
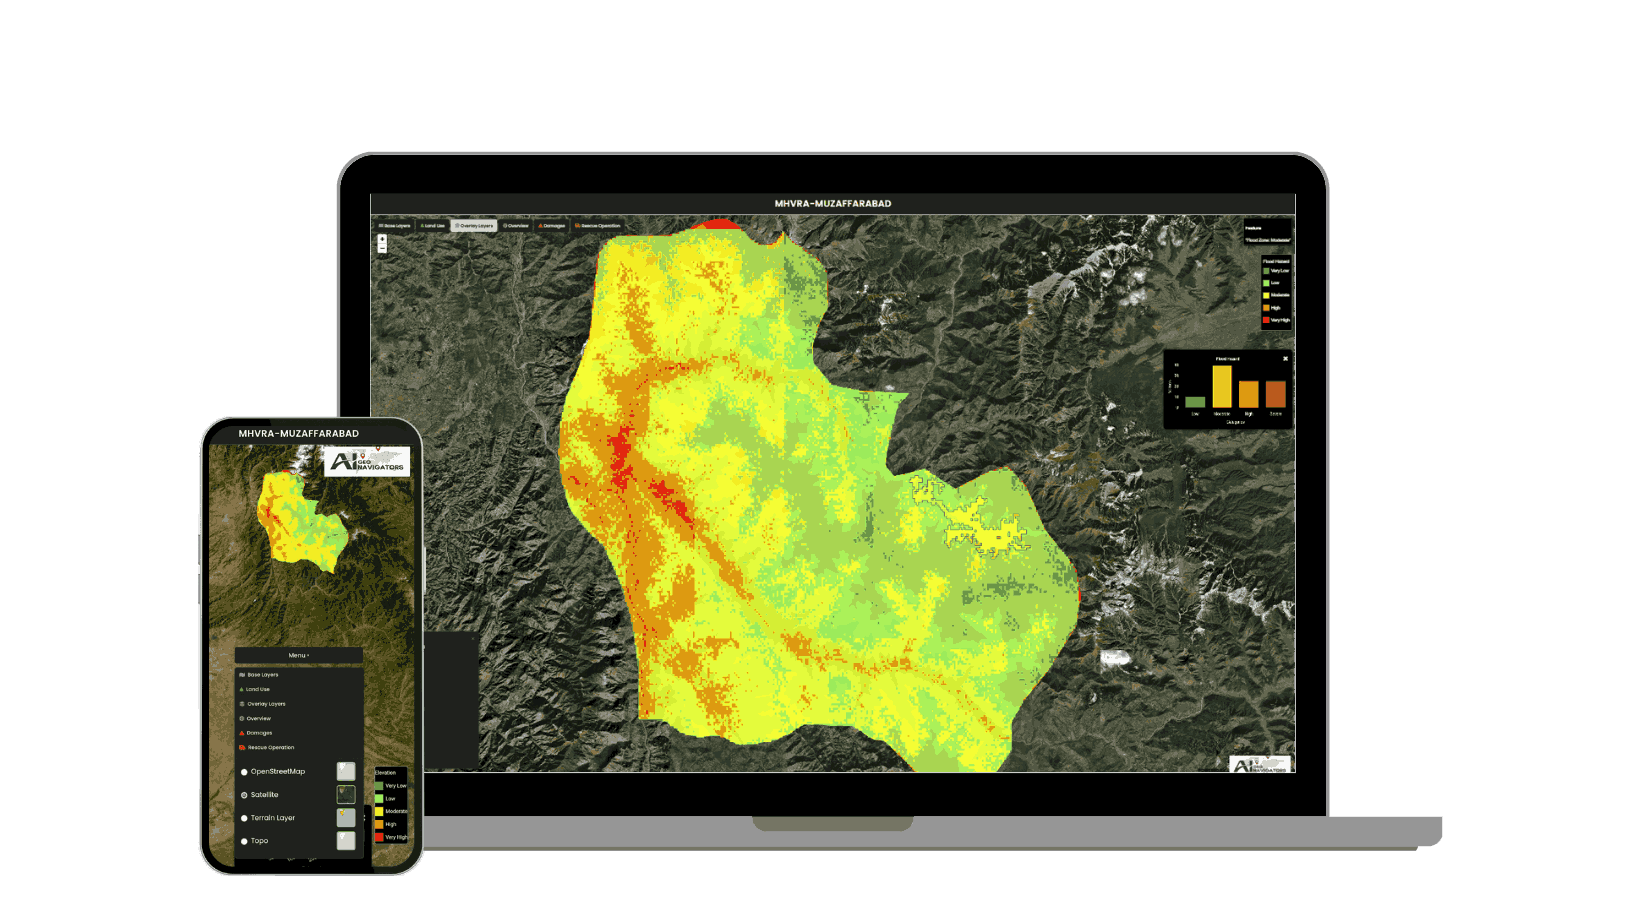
Dashboards monitor real-time climate patterns and analyze environmental changes with high-accuracy geospatial data.

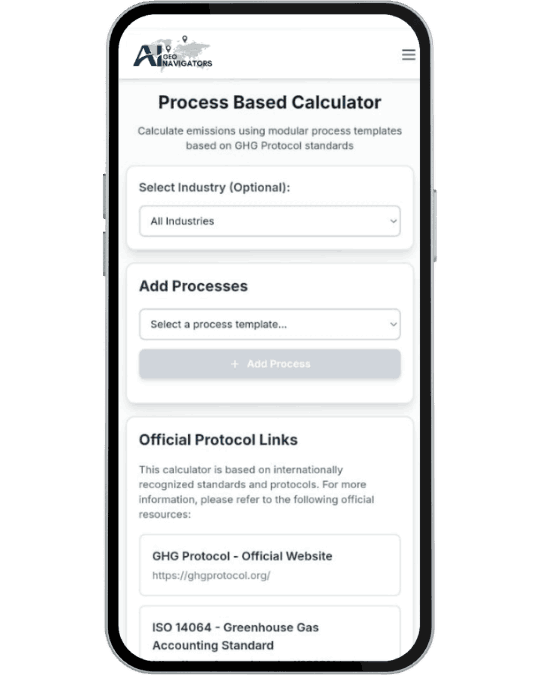
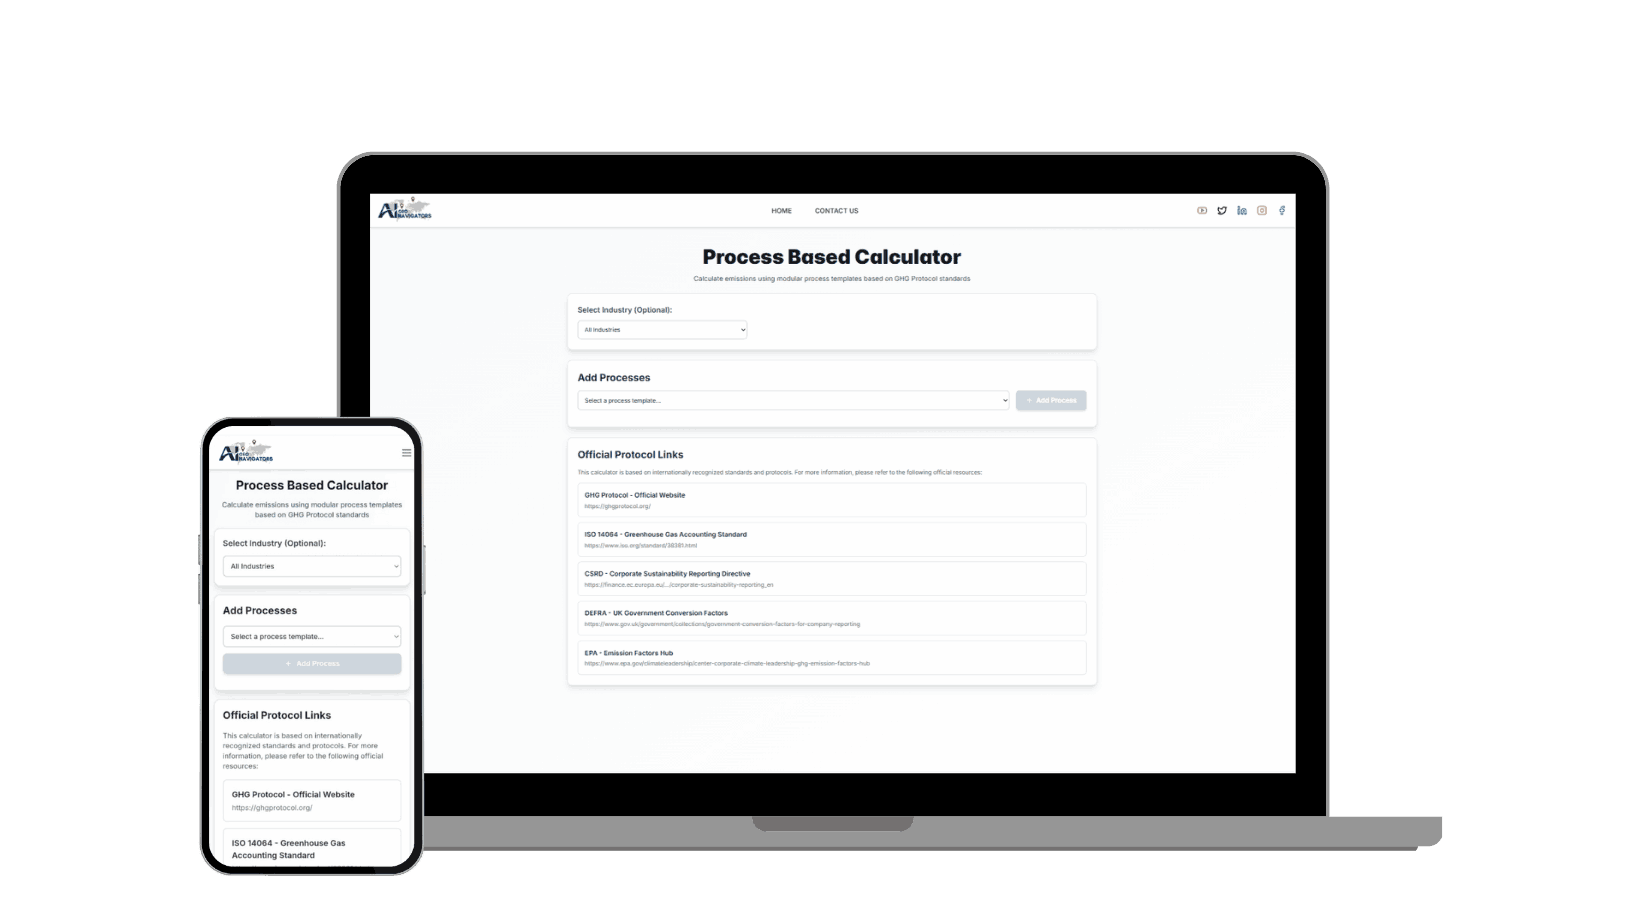
Track, calculate, and visualize carbon emissions for industries, cities, and sustainability projects.

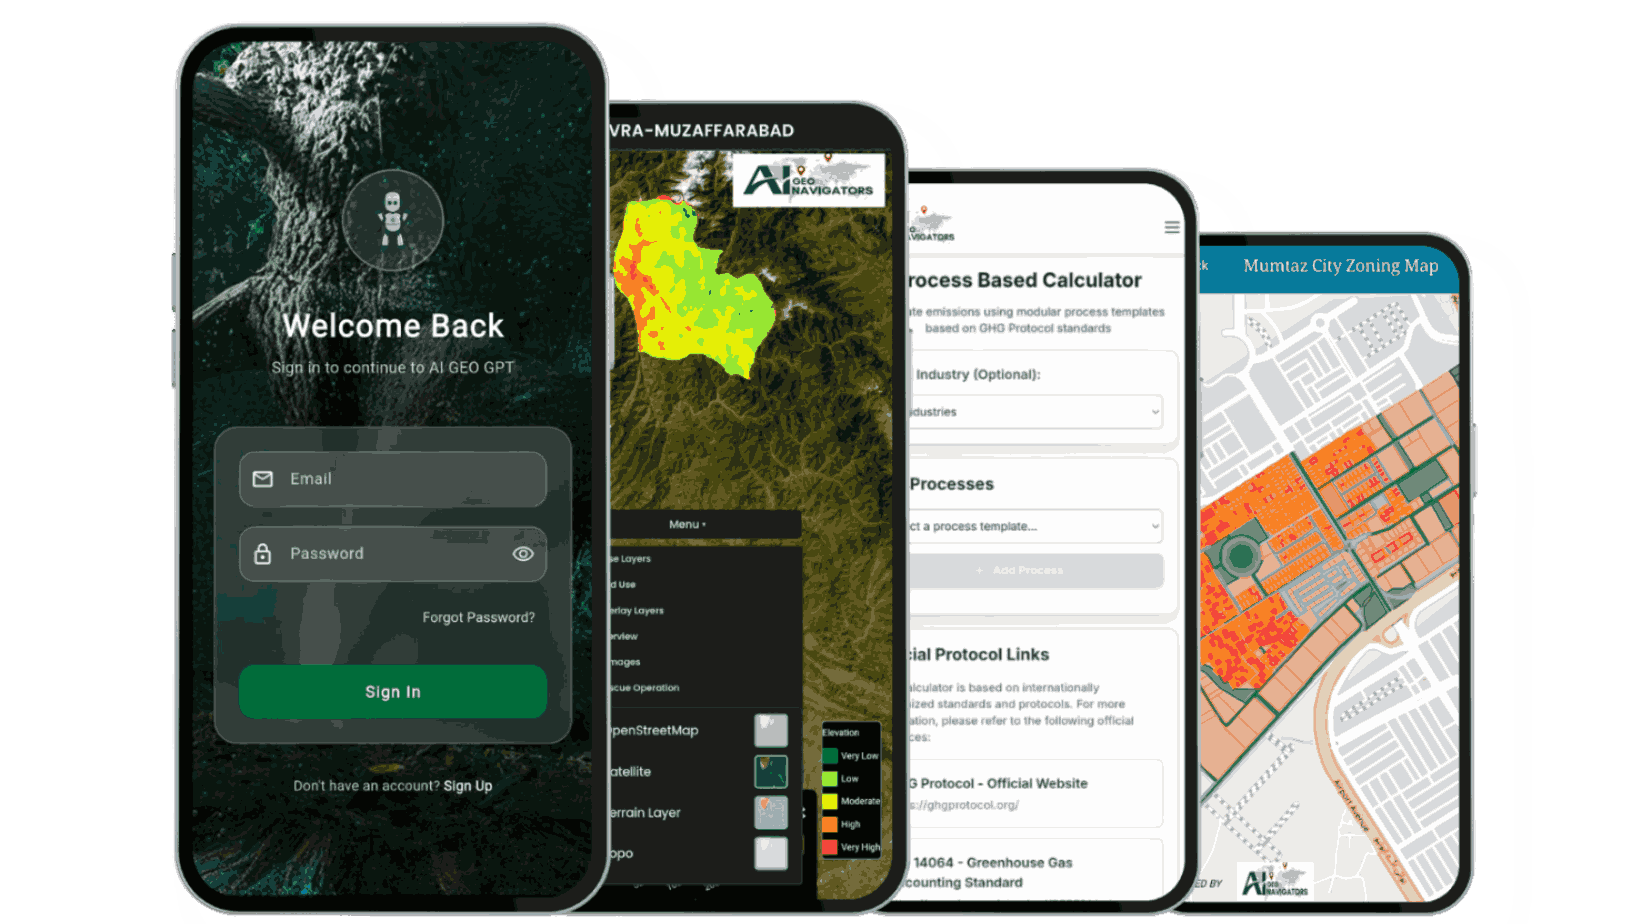
Access advanced GIS visualizations, heatmaps, and spatial layers for data-driven decision-making.

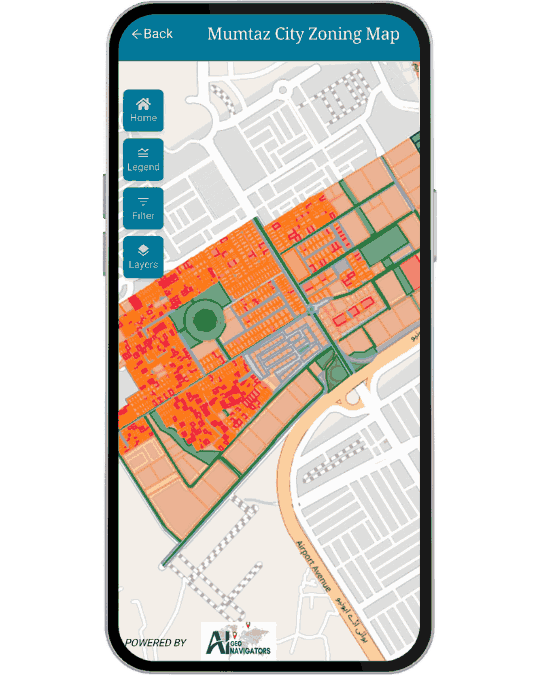
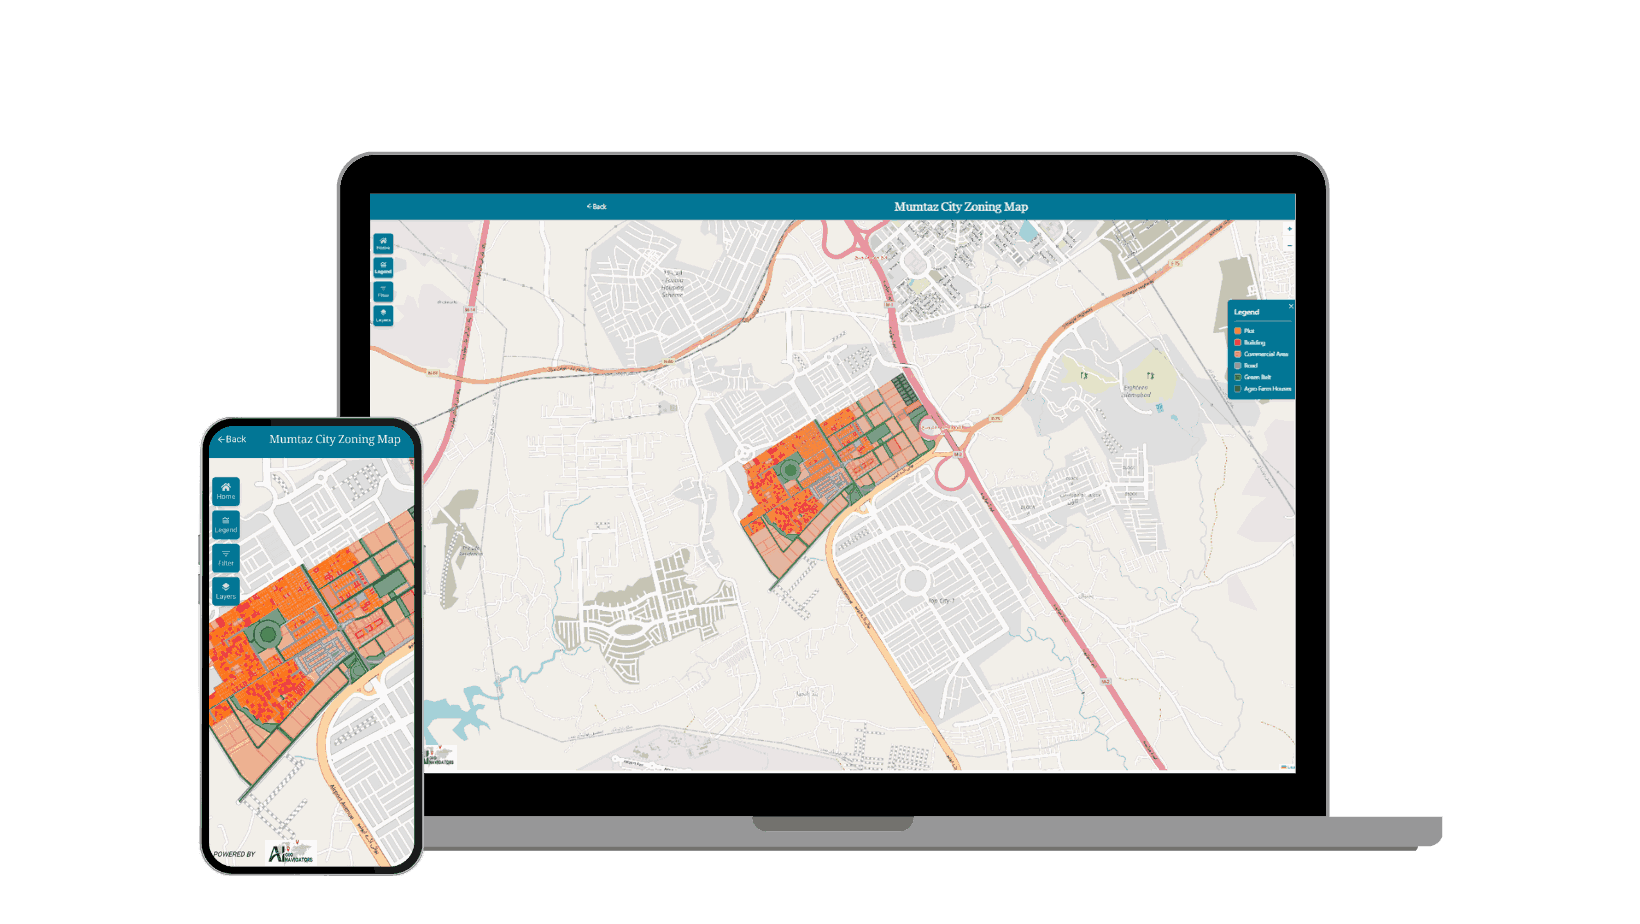
Digitize parcels, assess land use, and generate accurate zoning maps for planning and development.

Train, deploy, and monitor custom AI models built for climate forecasting and environmental analysis.

Generate instant environmental reports, sustainability summaries, and spatial analytics outputs.
An interactive AI assistant for questions around climate change, sustainability, and the UN Sustainable Development Goals, offering clear explanations and guidance.
Provides real time AI driven responses on climate, environment and sustainability topics.
Helps translate complex global sustainability issues into easy-to-understand explanations.
Supports users individuals, organizations or policymakers in understanding environmental challenges and planning climate-aware actions.
A GIS-based dashboard that shows land-use, zoning status and parcel distribution to help visualize which areas are sold, rented or available.
Interactive maps combining parcel data, land use layers, and regulatory overlays.
Helps developers, planners or investors quickly assess land status, plot availability, and property distribution.
Useful for cadastral mapping, land-management, and preventing boundary disputes by offering transparent property records.
A web-based tool to calculate and analyze emissions helping organizations understand and manage their carbon footprint under ESG metrics.
Calculates carbon emissions (e.g. Scope 1, Scope 2, Scope 3) for companies aiding in full carbon footprint assessment.
Helps businesses prepare ESG reports, align with global sustainability standards, and improve transparency.
Supports strategy development for emissions reduction, carbon credit procurement/offsetting, and long-term sustainability compliance.
An interactive GIS based risk-assessment platform that maps hazards and vulnerability to support disaster preparedness and planning.
Users can toggle multiple hazard layers stream lines, fault lines, geology, flood hazard, land use (LULC 2023), elevation, and precipitation to assess vulnerability in specific regions.
The portal displays categorized precipitation zones (Very Low to Very High) along with an interactive bar chart for easy comparison of rainfall values across the district.
Useful for government, NGOs or planners working on disaster risk reduction, emergency management, or climate-resilient infrastructure.
Our advanced GIS, Remote Sensing, and AI solutions help organizations visualize, analyze, and shape the future with confidence.